Contact
Office Locations
Home Office:
The Dunnican Team
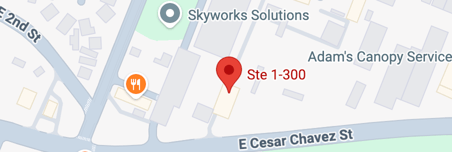
9106 Royal Burgess Dr
Rowlett TX 75089
Rockwall Office:
Coldwell Banker Apex, Realtors®
2555 Ridge Road #144
Rockwall TX 75087
By the Numbers
Curious about what the market’s doing in your neighborhood? Whether you’re thinking of buying, selling, or just staying informed, our local real estate market updates help you make smarter decisions. Below, you'll find the latest stats, trends, and expert commentary—broken down by county, city, and even neighborhood. This page is updated monthly with insights from The Dunnican Team’s on-the-ground expertise.

$1,254,000
MEDIAN SALES PRICE

21
CLOSED SALES

30
ACTIVE LISTINGS

6.5
MONTHS INVENTORY
Reporting Period: April 1–June 30, 2026 • Data via NTREIS / Texas REALTORS® Data Relevance Project
⚠ Limited Transaction Volume — Read with Caution: Only 21 homes closed in Parker during Q2 2026. At this volume, percentage comparisons — including the +0.3% median price figure, the −4.7% per-square-foot decline, and the 6.5 months of inventory — should be interpreted carefully. With 81% of Q2 sales above $1M and median home size jumping from 3,689 to 4,460 square feet year over year, the composition of which specific homes closed has a substantial effect on all reported metrics. The commentary below addresses this explicitly.
PRICES
Parker's median sale price came in at $1,254,000 in Q2 2026, essentially flat with a nominal 0.3% gain over Q2 2025. Median price per square foot, however, declined 4.7% to $276.86, while median home size increased from 3,689 to 4,460 square feet — a substantial 771-square-foot jump. This divergence is the defining interpretive challenge in Parker's Q2 data. When much larger homes close in greater proportions, the overall median can hold flat or rise even as per-unit values decline — a textbook mix-shift effect amplified by only 21 closed sales. In practical terms: if significantly larger estates closed in Q2 2026 than in Q2 2025, the $1,254,000 median is consistent with a per-square-foot softening of 4.7% once you account for the size difference. The genuine per-unit softening at $276.86/sq ft is real — Parker's ultra-premium segment is seeing modest value adjustment — but the magnitude is far less than a headline median comparison would suggest. The close-to-original-list-price ratio fell to 94.3% from 97.9% — a 3.6-point decline indicating buyers are successfully negotiating meaningful discounts, which is consistent with a buyer-leaning luxury market.
SALES ACTIVITY
Closed sales reached 21 in Q2 2026, up 5.0% from 20 in Q2 2025 — a one-home increase that is effectively flat. Days on market improved notably to 38 days, down 11 from Q2 2025's 49 — the strongest pace improvement in the report batch for a luxury market. Days to close also improved 3 days to 28. These are genuine positive signals: homes in Parker are finding buyers more quickly than a year ago, and transactions are completing efficiently. The 94.3% close-to-list ratio reflects that meaningful negotiation is standard at this price level — a gap of 5.7% from list to close is typical for an estate-style luxury market where each transaction involves individual negotiation on a high-value, unique property.
INVENTORY
Active listings held exactly flat at 30 in Q2 2026, unchanged from Q2 2025 — no meaningful supply change year over year. Months of inventory rose 0.9 to 6.5, placing Parker in buyer-leaning territory, though the change from a year ago reflects the absorption pace rather than a dramatic inventory expansion. With 30 active listings and 21 closings per quarter, supply modestly exceeds absorption but not dramatically so. The price distribution reflects Parker's ultra-premium character: 81.0% of Q2 sales were above $1M, 9.5% in the $750,000–$999,000 range, and 4.8% each in $400,000–$499,000 and $500,000–$749,000. The 20-year median home age reflects established acreage-lot estate properties in one of Collin County's most exclusive communities.
MARKET BALANCE
At 6.5 months of inventory in an ultra-premium market where 81% of transactions exceed $1M, Parker is in buyer-leaning territory — but in the context of a luxury estate market, this is a normal operating range rather than a distressed condition. The 38-day days on market (improving from 49) is the most positive signal in the dataset and suggests correctly priced Parker properties are finding qualified buyers with reasonable efficiency. The 94.3% close-to-list ratio — while lower than a year ago — reflects the inherent negotiating dynamic of individually priced luxury properties on large acreage lots. Parker's appeal: privacy, lot size, custom construction quality, and Collin County location — continues to attract a specific, motivated buyer segment that isn't easily redirected by broader market conditions.
Parker enters the second half of 2026 with improving pace dynamics (38-day DOM vs. 49 a year ago) and stable inventory (30 active listings, flat year over year) — two constructive signals that suggest the community is functioning reasonably well despite elevated months of inventory at 6.5. If the faster pace of Q2 2026 (38 days) continues into Q3, absorption should improve and months of supply may drift back toward 5.5–6.0, which would modestly improve seller positioning without eliminating buyer leverage.
The per-square-foot softening of 4.7% is real and should be factored into seller pricing expectations — but it is not a signal of market deterioration in a community that has seen substantial long-term appreciation and maintains a distinctly limited supply profile. Parker's acreage lots, custom construction, and Collin County location are structural advantages that limit how far values can fall even in challenging rate environments. If mortgage rates ease in Q4 2026, the luxury estate buyer profile that Parker targets — high net worth, often cash or large down payment, often relocation-driven — is likely to respond with renewed demand. Expect Parker to remain buyer-leaning through 2026 with gradual improvement as rate conditions allow.
Parker's ultra-premium estate market requires deep local expertise and transaction-level analysis. The Dunnican Team works throughout Collin County's luxury communities and can help you navigate Parker with the precision this market demands. Reach out anytime.
Source: NTREIS MLS / Texas REALTORS® Data Relevance Project — Parker, TX, Q2 2026 (April 1–June 30, 2026) with Q2 2025 comparison metrics. Data via MetroTex Association of REALTORS®. Analysis provided in partnership with the Real Estate Center at Texas A&M University. All figures reflect All Residential (SF + attached) — All Construction Types. Note: Low transaction volume (21 closed sales) and significant median home size variation (3,689 to 4,460 sq ft year over year) affect all reported metrics; individual comparable sales provide more reliable value guidance than aggregate statistics at this volume.
Property Address
Address
Is it a good time to sell a home in Parker in 2026?
Parker is a buyer-leaning luxury market at 6.5 months of supply, and sellers need to enter with accurate expectations and precise pricing strategy. The close-to-original-list ratio fell from 97.9% to 94.3% — buyers are successfully negotiating about 5.7% below original asking price, which on a $1.25M transaction represents a $71,000 gap between list and close on average. That gap rewards sellers who price accurately from day one and punishes those who test high — the difference between a 38-day transaction and one that accumulates 90-plus days before settling at a larger discount. The encouraging signals are real: days on market improved 11 days to 38, active listings held flat at 30, and the market is still closing 21 homes per quarter in a very low-supply, highly specific community. Sellers who anchor their pricing to current per-square-foot comparables for homes of similar size, lot, and condition — not the aggregate median, which is distorted by composition effects this quarter — and who present the property at the level the price point demands are finding that Parker's loyal buyer base is still present and active.
Is it a good time to buy a home in Parker in 2026?
Parker at 6.5 months of supply with a 94.3% close-to-list ratio offers the most buyer-favorable conditions this ultra-premium community has seen in several years. On a $1.25M transaction, a 5.7% below-list close represents real, substantial savings — and the 30 active listings provide meaningful selection in a community that typically trades fewer than 10 homes per month. The 4.7% per-square-foot softening to $276.86 reflects genuine value adjustment that translates to real dollar savings on large, custom estate homes. Parker's community identity — custom construction on substantial Collin County lots, 20-year median home age, privacy and prestige without density — is not easily replicated, and buyers who have specifically decided Parker is where they want to be are in the most favorable purchasing position available. The 38-day days on market improvement tells you correctly priced homes are still moving efficiently, which means the right property won't sit indefinitely. Buyers who are prepared, pre-approved, and clear on their priorities are best positioned to act decisively in this environment.
Are Parker home prices rising or falling in 2026?
The per-square-foot data points to modest softening; the overall median is essentially flat — and understanding why they diverge is the key to reading Parker accurately. The reported 0.3% median gain to $1,254,000 is not genuine appreciation — it reflects a significant home-size shift as median home size jumped from 3,689 to 4,460 square feet, with larger homes dominating Q2 closings. Per-square-foot value declined 4.7% to $276.86, which is the more reliable indicator of what's happening to underlying Parker home values. A 4.7% per-unit softening on a $1.25M home represents approximately $59,000 in value adjustment from recent peaks — real, but not dramatic in the context of a luxury acreage market where individual home characteristics drive outcomes as much as aggregate market trends. The 21-home quarterly transaction volume means these percentages can shift substantially based on which specific homes close in any given quarter, so individual comparable analysis remains essential for both buyers and sellers.
How long are homes sitting on the market in Parker?
Homes that closed in Q2 2026 averaged 38 days on market — down 11 days from Q2 2025's 49. That improvement is the most encouraging signal in Parker's Q2 data and suggests that sellers are pricing more realistically than a year ago, enabling faster matches with the qualified buyers who target this community. Days to close improved 3 days to 28 — also a positive trend — putting the total list-to-close timeline at approximately 66 days for correctly priced Parker homes, down 14 days from Q2 2025. That total timeline improvement of 14 days in a single year is meaningful in a luxury market where extended timelines are the norm. Sellers should note, however, that a 38-day average in a 21-closing-per-quarter market can be shifted by individual outliers — some Parker homes will move in under 20 days while others with pricing or condition challenges may take 90 or more. The average is a reference point, not a guarantee.
How competitive is the Parker real estate market right now?
Parker is buyer-leaning at 6.5 months of supply, but the nature of this market means "competitive" is defined differently than in higher-volume suburbs. With 30 active listings and 21 quarterly closings, there are more homes available than are selling in any given period — giving buyers genuine selection and time. The 94.3% close-to-list ratio tells you buyers are successfully negotiating about 5.7% below original asking price, which is meaningful at Parker's price points. Competition among buyers for any individual Parker home is limited — the buyer profile for a custom estate above $1M on substantial Collin County acreage is specific and relatively small at any moment. What makes Parker competitive isn't buyer-versus-buyer dynamics but buyer-versus-seller dynamics on individual properties: sellers and buyers who each have strong knowledge of specific comparable transactions — not just the aggregate median — negotiate from the most informed positions and typically reach the most efficient outcomes.
Buying or selling a luxury estate in Parker? Contact The Dunnican Team — we specialize in Collin County's premium communities and bring the transaction-level expertise this market demands.
Acreage Living at the Edge of Collin County, with a Surprising Amount of Convenience
Parker sits at a geographic crossroads that most people drive through without realizing it exists as an incorporated city. Located at the intersection of Parker Road and FM 2514 in southern Collin County, Parker is surrounded by Allen, Plano, Lucas, and Murphy — and despite being hemmed in by all four, it has maintained a distinctly rural-residential character that none of its neighbors can match.
The city covers a relatively small footprint but is zoned almost entirely for single-family residential use on larger lots. There's no commercial strip along Parker Road within the city limits — just neighborhoods, trees, and space. For buyers who have been searching along the SH-78 or US-75 corridors and want land without driving deep into the country, Parker offers a middle path that's hard to replicate this close to Plano.
Parker's population hovers around 5,000, and it moves slowly by design. The city council has historically resisted the kind of development pressure that has transformed neighboring Lucas and Murphy, which means Parker today looks much like Parker did fifteen years ago — in the best possible way.
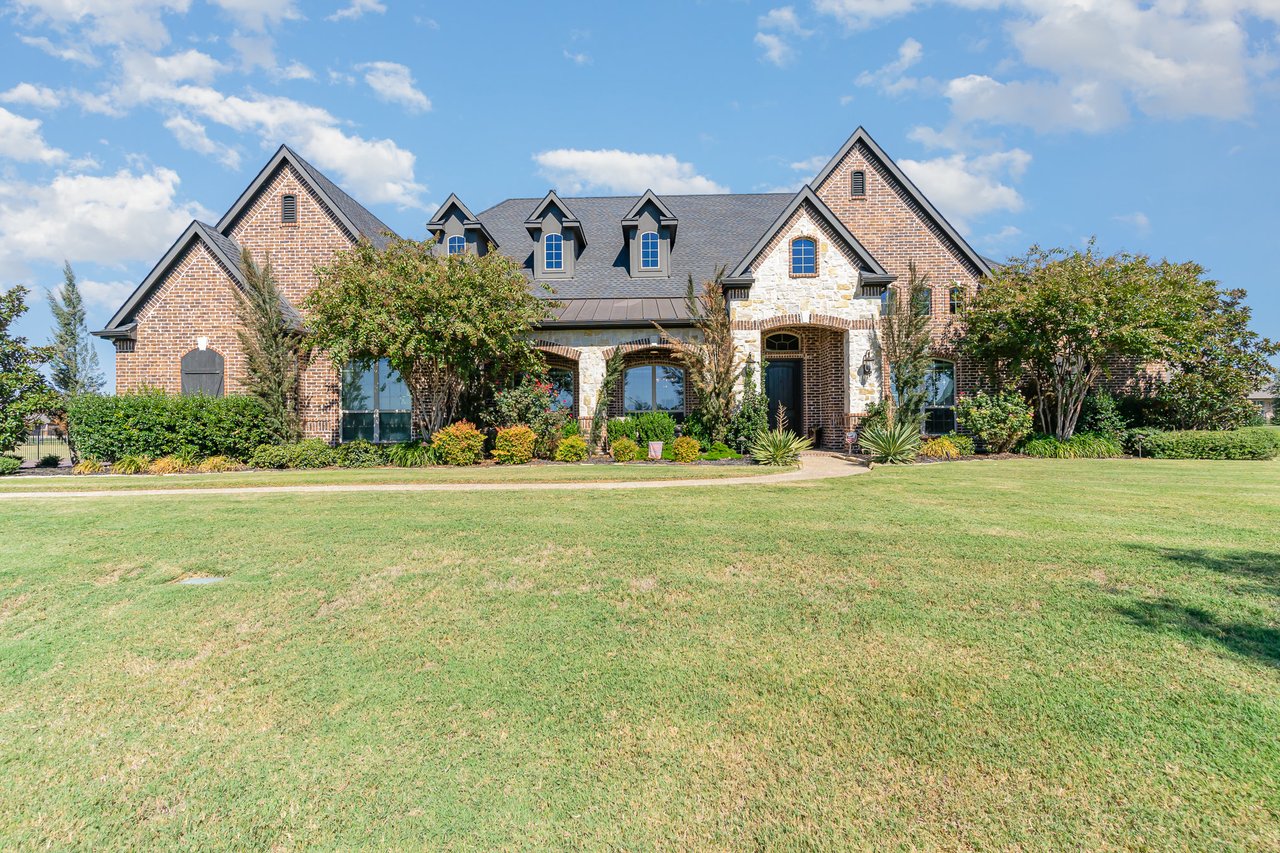
Parker's housing stock is defined by lot size. Most properties here sit on a minimum of one acre, and many significantly exceed that. The homes themselves range from modest ranch-style builds from the 1970s and 1980s to updated custom homes and newer construction that takes full advantage of the space available.
Property types include:
Parker attracts a very specific buyer — one who has done the research, knows exactly what they want, and decided that an acre or more this close to Plano is worth every dollar.
Top reasons buyers are making the move:
Cindy and Cory Dunnican of The Dunnican Team at Coldwell Banker Apex, Realtors® know how to value acreage, navigate the nuances of older homes on large lots, and help buyers understand the real cost and opportunity of a property that doesn't fit a standard MLS comparison. Parker is a market that rewards patience and local knowledge — they bring both.
Our team knows how to position your property for success in today’s shifting market. Get expert pricing, staging tips, and a custom marketing plan.
We’ll help you explore the latest listings, tour homes, and find the right fit for your lifestyle and budget.

9106 Royal Burgess Dr Rowlett TX 75089
9106 Royal Burgess Dr Rowlett TX 75089