


Garland, TX Housing Market Update – September 2026
Garland Housing Market Update | Reporting Period: Sep 1–Sep 30, 2026 • Data via NTREIS MLS
About this report. This is The Dunnican Team's monthly housing market update for Garland, Texas. Every figure comes straight from NTREIS MLS transaction data — what homes actually sold for, not estimates or automated valuations — and each one is measured against the same month a year earlier, because a number only means something when you can see what it used to be. Below you'll find the median sale price, closed sales, active inventory, months of supply, and days on market, along with what each of those actually means if you're weighing a move. We publish these every month so you can watch the trend rather than react to a single number. It's the same picture we walk our own clients through, explained the way we'd explain it across the table.
Quick Read
Garland stands out this month because buyer activity improved. Closed sales rose 10.6% to 136 while active listings fell 11.9% to 583, pulling months of inventory down to 3.9, which leans toward sellers. Homes also sold faster, going under contract in a median of 42 days. Pricing adjusted along the way, with price per square foot down 5.5%, a larger decline than the 1.7% dip in the median.
Key Highlights | Garland Housing Market Update
- Median Price: $295,000 (−1.7% YoY)
- Closed Sales: 136 (+10.6% YoY)
- Active Listings: 583 (−11.9% YoY)
- Months of Inventory: 3.9 (−0.5 from September 2025)
Market Commentary
PRICES
The Garland median sale price was $295,000 in September 2026, down 1.7% from September 2025, which keeps pricing in stable territory. Median price per square foot fell further, down 5.5% to $172.26. When price per square foot falls faster than the median, the homes that sold were somewhat larger, and value per square foot softened. The $200,000–$299,999 range was the most active, at 38.5% of closed sales, followed by $300,000–$399,999 at 31.5%. Homes closed at a median of 93.5% of original list price, close to the DFW Metroplex at 93.8%. For context, the DFW median was $379,990 and the Texas median was $329,900.
SALES ACTIVITY
A total of 136 homes closed in Garland in September, up 10.6% from 123 in September 2025, a sign of steady buyer follow-through. The median home took 42 days to go under contract, 15 days faster than a year ago, and 28 days from contract to close, two days faster. Total time from listing to closing was 70 days, compared with 95 days across the DFW Metroplex.
INVENTORY
Active listings totaled 583, down 11.9% from 662 a year ago, which means tighter selection for buyers. Unlike markets where listings and sales are falling together, Garland's inventory is shrinking alongside stronger sales, not a pullback in activity.
MARKET BALANCE
Months of inventory fell to 3.9 from 4.4 a year ago, just under the 4.0-month level that typically favors sellers. That's tighter than the DFW Metroplex at 4.5 months and Texas at 5.5 months. Garland has moved from balanced to slightly seller-leaning, a shift that came as price per square foot adjusted lower.
What Sellers Need to Know
- At 3.9 months of supply and 42 days to contract, Garland homes are selling faster than the DFW pace of 63 days.
- Price per square foot fell 5.5%, so price to current comparable sales rather than last year's numbers.
- Homes closed at a median of 93.5% of original list price, close to the DFW median.
- Fewer competing listings, down 11.9% from a year ago, work in your favor if your home is priced right.
What Buyers Need to Know
- Selection is tighter than a year ago, with 583 active listings and 3.9 months of supply.
- Price per square foot is down 5.5%, so values have eased even as competition picked up.
- Well-priced homes are going under contract in about 42 days, so have your financing ready before you find the right one.
- The $200,000–$399,999 range accounted for 70.0% of September's sales, which gives you the deepest set of comparable sales to work from.
Garland Housing Market Outlook: Fall 2026
Garland heads into the fall with improving sales, shrinking inventory, and lower price per square foot than a year ago. If closings hold near September's pace while listings stay below last year's level, months of supply could stay under 4.0 through the holidays, keeping conditions slightly in sellers' favor. Mortgage rates moved higher through late September and early October, and if they stay elevated, that could slow the momentum seen in September, particularly in the $200,000–$399,999 range where most sales occur. If rates ease, tight supply suggests competition for well-priced homes would pick up quickly. Sellers who price to current comparable sales are best positioned to benefit.
Trending in Real Estate News
- Housing Market Update: Asking Prices Fall for the First Time Since March (Redfin, October 15, 2026)
National asking prices slipped below last year's level, a record share of sellers cut their price, and Dallas was among the metros with the steepest drop in new listings. - Zillow September 2026 Market Report (Zillow Research, October 6, 2026)
Newly pending sales fell sharply nationwide in September as mortgage rates climbed, while home values stayed close to flat. - Have Mortgage Rates Peaked, or Will We See Even More Chaos? (HousingWire, October 10, 2026)
A look at the bond-market volatility behind this fall's higher mortgage rates, and what it has meant for pending sales and price cuts. - Homebuyers Have More Fresh Options Than They've Had in 4 Years (Redfin, September 3, 2026)
New listings rose nationally while demand stayed flat, though Dallas and Fort Worth were exceptions, with fewer new listings than a year earlier.
Numbers describe a market. They do not describe your home, your street, or your timeline. If you are weighing a move in Garland, Texas, Cindy and Cory Dunnican are glad to walk through what this data means for your specific situation — no pressure, no obligation. Get in touch with The Dunnican Team or call 972-679-1789.
Source: Texas REALTORS® Data Relevance Project via MetroTex Association of REALTORS® (Garland, Dallas-Fort Worth-Arlington MSA, and Texas; September 2026, with September 2025 comparisons). Underlying data from NTREIS MLS; analysis provided through the Texas Real Estate Research Center at Texas A&M University.
Garland Housing Market FAQs – September 2026
Is it a good time to sell a home in Garland?
Conditions are improving for sellers. Closed sales rose 10.6% in September 2026, active listings fell 11.9%, and months of inventory dropped to 3.9. Price per square foot fell 5.5%, though, so pricing to current comparable sales matters.
Is it a good time to buy a home in Garland?
Values have eased, with price per square foot down 5.5%, but selection is tighter and homes are selling faster. Expect well-priced homes to go under contract in about 42 days.
How long are homes taking to sell in Garland?
In September 2026, the median home took 42 days to go under contract and 28 days from contract to close, for 70 days in total. That's 17 days faster than a year ago and faster than the DFW Metroplex at 95 days.
Are home prices rising or falling in Garland?
Easing slightly. The median was $295,000, down 1.7%, and price per square foot fell 5.5% to $172.26. The larger per-square-foot decline means the homes that sold were somewhat larger, while value per square foot softened.
How competitive is the Garland housing market?
More competitive than a year ago. At 3.9 months of inventory, Garland leans slightly toward sellers, and it's tighter than the DFW Metroplex at 4.5 months. Most sales fall between $200,000 and $399,999.
Have questions about what these numbers mean for your home or your search? Connect with The Dunnican Team. We're glad to walk through your neighborhood and price range.
DFW Real Estate Insights
Sign-up to receive monthly local market updates, homeowner guidance, buying and selling strategies, and useful information about North Texas communities from The Dunnican Team.
What's My Home Worth?
Get a real answer, not an algorithm's guess. Cindy and Cory personally research your home's value using current local sales and market data. The more information you provide, the more accurate your report will be.
Garland Homes For Sale
2
3
4
5
6
7
8
9
10
11
12
13
14
15
16
17
18
19
20
21
22
23
24
25
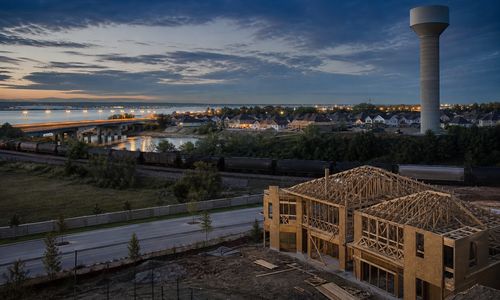
New Construction Homes in Rockwall, What to Know First
Buying new construction in Rockwall means dealing with a builder's contract, a sales representative who works for the…
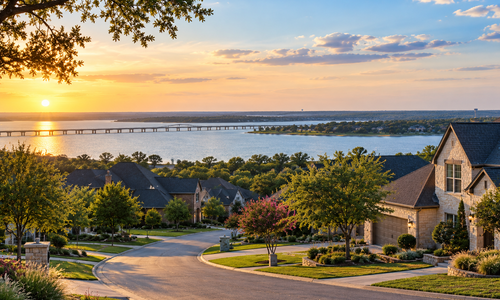
Northeast Dallas Suburbs and How Location Shapes Lifestyle
Choose the area first, because in the Northeast Dallas suburbs your commute, lake access, retail convenience, and development…

How Much Cash Eastern Metro Home Buyers Actually Need …
Buying a home in Northeast Dallas and the Eastern Metro requires more cash than the down payment alone.…

Aluminum Wiring Garland TX Homes
A Texas inspector is required to tell you a Garland home has aluminum branch wiring — and is…
How to Find a Listing Agent in Garland, TX
Garland is crossed by more administrative lines than almost anywhere in Northeast Dallas — three counties, four school…
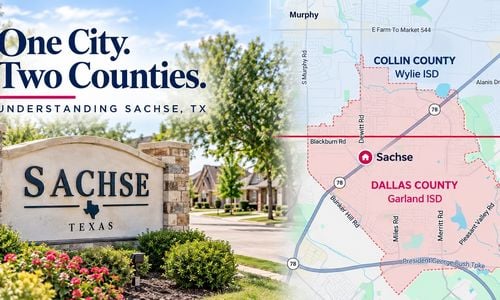
Is Sachse in Dallas County or Collin County?
Sachse is small enough to tour in an afternoon and never notice you crossed a county line. But…

How to Prepare Your DFW Home for Freezing Temperatures
From frozen pipes to power outages, here's how to winterize your DFW home before the next hard freeze…
First-Time Home Buyer Programs in Garland, TX: You May …
Most people assume "first-time buyer" means you've never owned property. The federal regulation says something narrower and more…

How Accurate Is Zillow's Zestimate in Texas?
Texas is a non-disclosure state — what homes sell for here isn't public record. Automated estimates are built…

Buying or Selling a Home With a Pool in …
Most of what you'll read about Texas pool fence law is wrong, and the inspection that would catch…

Buyer Closing Costs in Texas: What You'll Actually Pay
Most buyers focus on the down payment and forget there's another number that needs to be ready on…

What Happens After You Accept an Offer in Texas: …
You accepted an offer — now what? In Texas, the next 30–45 days include an option period, title…
Let's Get Social
 9
We’re Cindy and Cory Dunnican—husband-and-wife Realtors, longtime North Texas residents, and the team behind The Dunnican Team. 🏡
Since 1998, we’ve helped more than 1,850 clients buy and sell homes across North Texas. With 285+ five-star reviews, 28+ years of experience, and a reputation built on honest guidance and p…
9
We’re Cindy and Cory Dunnican—husband-and-wife Realtors, longtime North Texas residents, and the team behind The Dunnican Team. 🏡
Since 1998, we’ve helped more than 1,850 clients buy and sell homes across North Texas. With 285+ five-star reviews, 28+ years of experience, and a reputation built on honest guidance and p…
 2
📍 2903 Meadow Bluff Dr, Wylie, TX
💰 $450,000
Inside, you’ll find oversized rooms, multiple living spaces, a game room, walk-in closets in every bedroom, and a kitchen with abundant cabinetry, leathered granite, a large island, updated stainless appliances, and a huge walk-in pantry.
Out back, the sparkling pool with …
2
📍 2903 Meadow Bluff Dr, Wylie, TX
💰 $450,000
Inside, you’ll find oversized rooms, multiple living spaces, a game room, walk-in closets in every bedroom, and a kitchen with abundant cabinetry, leathered granite, a large island, updated stainless appliances, and a huge walk-in pantry.
Out back, the sparkling pool with …
 2
🏌️♂️ Golf course views right from your backyard.
10617 Gleneagles Lane sits directly on the 14th fairway of Waterview Golf Course and brings together the features buyers keep asking for:
✨ Single-story layout
✨ No carpet
✨ Granite kitchen with white cabinetry
✨ Open kitchen, breakfast + family room
✨ Gas fireplace
✨…
2
🏌️♂️ Golf course views right from your backyard.
10617 Gleneagles Lane sits directly on the 14th fairway of Waterview Golf Course and brings together the features buyers keep asking for:
✨ Single-story layout
✨ No carpet
✨ Granite kitchen with white cabinetry
✨ Open kitchen, breakfast + family room
✨ Gas fireplace
✨…
 1
🗞️ EXTRA! EXTRA! READ ALL ABOUT IT! 🗞️
🚨 BREAKING NEWS FROM WATERVIEW! 🚨
A beautifully updated Rowlett home just got an even BETTER price… and you're invited to see it this weekend! 👀🏡
💥 NEW PRICE: $450,000! 💥
📍 10417 Eastern Hills Ct | Rowlett, TX
📅 Saturday, October 24
⏰ 2:00–4:00 PM
Here's the scoop on what mak…
1
🗞️ EXTRA! EXTRA! READ ALL ABOUT IT! 🗞️
🚨 BREAKING NEWS FROM WATERVIEW! 🚨
A beautifully updated Rowlett home just got an even BETTER price… and you're invited to see it this weekend! 👀🏡
💥 NEW PRICE: $450,000! 💥
📍 10417 Eastern Hills Ct | Rowlett, TX
📅 Saturday, October 24
⏰ 2:00–4:00 PM
Here's the scoop on what mak…
 1
Thinking about buying a luxury home in Heath? 🏡
The market here is more nuanced than a single price point. Heath’s high-end homes include true lakefront estates, lake-view properties, golf-community homes, and custom homes on larger lots — and each one comes with a different set of value drivers, costs, and due-dilige…
1
Thinking about buying a luxury home in Heath? 🏡
The market here is more nuanced than a single price point. Heath’s high-end homes include true lakefront estates, lake-view properties, golf-community homes, and custom homes on larger lots — and each one comes with a different set of value drivers, costs, and due-dilige…
 3
🚨 NEW PRICE. SAME AMAZING HOME. OPEN HOUSE THIS SATURDAY! 🏡🔥
Looking for an updated home in Rowlett with standout style, tons of space, and an incredible location? **This is your sign to come take a look! 👀
🔗 Link in Bio
📍 10417 Eastern Hills Ct | Rowlett, TX
💰 NOW $450,000!
📅 Saturday, October 24
⏰ 2–4 PM
Here’s w…
3
🚨 NEW PRICE. SAME AMAZING HOME. OPEN HOUSE THIS SATURDAY! 🏡🔥
Looking for an updated home in Rowlett with standout style, tons of space, and an incredible location? **This is your sign to come take a look! 👀
🔗 Link in Bio
📍 10417 Eastern Hills Ct | Rowlett, TX
💰 NOW $450,000!
📅 Saturday, October 24
⏰ 2–4 PM
Here’s w…
 3
🏡✨ OPEN HOUSE ALERT! YOUR SATURDAY PLANS JUST GOT BETTER!
Looking for a home with personality, impressive updates, AND an incredible location? 👀 We've got one you need to see!
📍 10417 Eastern Hills Ct | Rowlett, TX 75089
📅 Saturday, October 24
⏰ 2:00–4:00 PM
💰 NOW Offered at $450,000
Located in the sought-after Wate…
3
🏡✨ OPEN HOUSE ALERT! YOUR SATURDAY PLANS JUST GOT BETTER!
Looking for a home with personality, impressive updates, AND an incredible location? 👀 We've got one you need to see!
📍 10417 Eastern Hills Ct | Rowlett, TX 75089
📅 Saturday, October 24
⏰ 2:00–4:00 PM
💰 NOW Offered at $450,000
Located in the sought-after Wate…
 3
Thinking about buying in Rockwall? The growth is real — but that doesn’t automatically make every home a smart buy.
In our latest blog post, we break down what buyers should actually look at in 2026, including:
• Rockwall County’s rapid population growth
• What current home prices and days on market are telling us
• …
3
Thinking about buying in Rockwall? The growth is real — but that doesn’t automatically make every home a smart buy.
In our latest blog post, we break down what buyers should actually look at in 2026, including:
• Rockwall County’s rapid population growth
• What current home prices and days on market are telling us
• …
 2
What Comes With the Address? 📍
1006 Angel Street | Josephine, TX
A little more space. A fresh start. A growing North Texas community.
#MTHDFW #JosephineTX #NevadaTX #DFWRealEstate #DallasHomesforSale
A Change of Pace 🌾
Enjoy Josephine’s small-town, country atmosphere while remaining part of the growing Northeast D…
2
What Comes With the Address? 📍
1006 Angel Street | Josephine, TX
A little more space. A fresh start. A growing North Texas community.
#MTHDFW #JosephineTX #NevadaTX #DFWRealEstate #DallasHomesforSale
A Change of Pace 🌾
Enjoy Josephine’s small-town, country atmosphere while remaining part of the growing Northeast D…
 5
😂 OPEN HOUSE ALERT! YOUR SATURDAY PLANS JUST GOT BETTER!
Looking for a home with personality, impressive updates, AND an incredible location? 👀 We’ve got one you need to see!
📍 10417 Eastern Hills Ct | Rowlett, TX 75089
📅 Saturday, October 24
⏰ 2:00–4:00 PM
💰 Offered at $455,000
Located in the sought-after Waterview…
5
😂 OPEN HOUSE ALERT! YOUR SATURDAY PLANS JUST GOT BETTER!
Looking for a home with personality, impressive updates, AND an incredible location? 👀 We’ve got one you need to see!
📍 10417 Eastern Hills Ct | Rowlett, TX 75089
📅 Saturday, October 24
⏰ 2:00–4:00 PM
💰 Offered at $455,000
Located in the sought-after Waterview…
 2
🏡✨ OPEN HOUSE ALERT! YOUR SATURDAY PLANS JUST GOT BETTER!
Looking for a home with personality, impressive updates, AND an incredible location? 👀 We’ve got one you need to see!
📍 10417 Eastern Hills Ct | Rowlett, TX 75089
📅 Saturday, October 24
⏰ 2:00–4:00 PM
💰 Offered at $455,000
Located in the sought-after Watervie…
2
🏡✨ OPEN HOUSE ALERT! YOUR SATURDAY PLANS JUST GOT BETTER!
Looking for a home with personality, impressive updates, AND an incredible location? 👀 We’ve got one you need to see!
📍 10417 Eastern Hills Ct | Rowlett, TX 75089
📅 Saturday, October 24
⏰ 2:00–4:00 PM
💰 Offered at $455,000
Located in the sought-after Watervie…
 2
Thinking about moving up in Northeast Dallas? 🏡
Before you start touring bigger homes, there are a few important decisions to make first — especially if you also need to sell your current home.
In our latest blog post, we break down:
• whether it makes more sense to sell first or buy first
• how your current equity …
2
Thinking about moving up in Northeast Dallas? 🏡
Before you start touring bigger homes, there are a few important decisions to make first — especially if you also need to sell your current home.
In our latest blog post, we break down:
• whether it makes more sense to sell first or buy first
• how your current equity …
