Contact
Office Locations
Home Office:
The Dunnican Team
9106 Royal Burgess Dr
Rowlett TX 75089
Rockwall Office:
Coldwell Banker Apex, Realtors®
2555 Ridge Road #144
Rockwall TX 75087
By the Numbers
Curious about what the market’s doing in your neighborhood? Whether you’re thinking of buying, selling, or just staying informed, our local real estate market updates help you make smarter decisions. Below, you'll find the latest stats, trends, and expert commentary—broken down by county, city, and even neighborhood. This page is updated monthly with insights from The Dunnican Team’s on-the-ground expertise.

$315,000
MEDIAN SALES PRICE

166
CLOSED SALES

307
ACTIVE LISTINGS

6.0
MONTHS INVENTORY
Reporting Period: April 1–June 30, 2026 • Data via NTREIS / Texas REALTORS® Data Relevance Project
PRICES
Forney's median sale price came in at $315,000 in Q2 2026, a 10.0% decline from Q2 2025. Unlike some markets in this report where headline median shifts can be attributed to a mix of homes selling, Forney's data indicates genuine pricing pressure: median price per square foot declined 5.6% to $150.10, while median home size remained nearly flat at 2,112 square feet, up slightly from 2,080 a year ago. When both the overall median and the per-square-foot figure decline with home size essentially unchanged, the softening is real — not a statistical artifact of composition. Forney is a predominantly new construction community with a 7-year median home age, and the pricing decline reflects competitive builder pricing in a market where supply has outpaced absorption for several quarters. The close-to-original-list-price ratio of 94.4% — down 3.2 points from 97.6% — confirms that buyers are negotiating meaningful discounts from list price with regularity.
SALES ACTIVITY
Closed sales fell to 166 in Q2 2026, a 23.5% decline from 217 in Q2 2025. That's a significant pullback in transaction volume, and it reflects the combination of elevated supply, softened pricing, and buyers taking more time to commit in a market where they know inventory exists and leverage is on their side. Notably, days on market actually improved to 71 days, down 18 days from Q2 2025's 89 — a counterintuitive improvement that likely reflects builders aggressively pricing spec homes to move inventory rather than allowing homes to sit. When builders reduce prices proactively to meet market demand, DOM improves even in a softening environment. The 94.4% close-to-list ratio tells you the real negotiating action is happening at the offer stage, not through extended DOM — buyers are getting below-list prices within a compressed timeline.
INVENTORY
Active listings came in at 307 in Q2 2026, down just 3.5% from 318 in Q2 2025 — a marginal inventory decline that has not meaningfully reduced buyer leverage. At 6.0 months of supply — up 1.9 months year over year — Forney sits firmly in buyer-leaning territory, the most elevated inventory reading among the primary Rockwall County and Kaufman County markets tracked in this report. The price distribution is concentrated in affordable new construction ranges: 36.4% of Q2 sales were in the $200,000–$299,999 band and 35.8% in $300,000–$399,000. Together, those two bands account for 72% of all closings. The near absence of sales above $500,000 (6.8% combined) confirms this is fundamentally an affordable-to-mid-range new construction market.
MARKET BALANCE
At 6.0 months of inventory, Forney is in buyer-leaning territory by a clear margin. The combination of genuine per-square-foot price softening, a 94.4% close-to-list ratio, and declining transaction volume all point in the same direction: buyers have real leverage in Forney right now, and sellers — particularly builders with spec inventory — are pricing to move rather than holding firm. For resale sellers, this environment is challenging. Competing directly against builder product at reduced prices, with buyers who have time and options, requires precise pricing strategy and careful attention to condition and presentation. For buyers, this is one of the most favorable purchasing environments in the broader east DFW corridor.
Forney's near-term outlook hinges on the pace at which builder spec inventory is absorbed relative to new starts. At 6.0 months of supply against a backdrop of declining transaction volume, the market will need either a meaningful uptick in buyer demand or a significant reduction in new inventory coming to market — or both — before pricing pressure eases. If builders pull back on new starts in Q3 2026, the active listing count should begin declining more rapidly, which would tighten months of supply and gradually reduce buyer leverage over Q4.
If mortgage rates ease meaningfully in the back half of 2026, Forney's affordable price point — with the bulk of activity in the $200,000–$399,000 range — positions it well to capture a surge of first-time and rate-sensitive buyers who have been qualifying and waiting. That demand pool is real and substantial; the rate environment is the primary release valve. Without rate improvement, expect pricing to remain under modest pressure through Q4 2026 with the median likely settling in the $300,000–$320,000 range. For resale sellers, the environment will remain challenging as long as builder incentives and reduced pricing define the competitive landscape. For buyers, this is a favorable entry window that may narrow considerably if rates improve and demand returns.
Whether you're a buyer looking to take advantage of Forney's current market conditions or a seller trying to navigate a competitive environment, The Dunnican Team works across the east DFW corridor and can help you build a strategy grounded in the actual data. Reach out anytime.
Source: NTREIS MLS / Texas REALTORS® Data Relevance Project — Forney, TX, Q2 2026 (April 1–June 30, 2026) with Q2 2025 comparison metrics. Data via MetroTex Association of REALTORS®. Analysis provided in partnership with the Real Estate Center at Texas A&M University. All figures reflect All Residential (SF + attached) — All Construction Types.
Property Address
Address
Is it a good time to sell a home in Forney in 2026?
Forney is a challenging market for resale sellers right now, and honesty about that is the most useful thing we can offer. At 6.0 months of supply with 307 active listings, buyers have real alternatives — including builder inventory priced competitively with incentive programs that resale sellers typically cannot match. The close-to-original-list ratio of 94.4% means buyers are negotiating an average of 5.6% below original asking price. Resale sellers who price accurately to current market conditions, present their home well, and highlight what distinguishes their property from new construction — known condition, established landscaping, no wait time, negotiable terms — can still achieve solid outcomes. Sellers who price to 2024 comparables or test the market high will find their home sitting in a 6-month supply environment while builder competition undercuts them.
Is it a good time to buy a home in Forney in 2026?
For buyers, Forney's current conditions are among the most favorable in the eastern DFW corridor. The median sale price fell 10.0% to $315,000, the close-to-original-list ratio sits at 94.4%, and 6.0 months of supply gives buyers real selection and meaningful negotiating leverage. With 72% of Q2 sales concentrated in the $200,000–$399,000 range and a 7-year median home age, Forney offers newer construction at some of the most accessible price points available in the greater DFW area. Builders are actively offering rate buydowns, closing cost assistance, and upgrade incentives to maintain sales pace — incentives that often add more value than a pure list price reduction. If mortgage rates ease in the back half of 2026, this price point and community profile are likely to see accelerated competition. The buyer window that exists right now may look considerably narrower by early 2027.
Why are Forney home prices falling in 2026?
Forney's 10.0% median price decline to $315,000 reflects genuine pricing pressure in a new construction market where supply has outpaced absorption for several quarters. Unlike some DFW markets where price declines are partially explained by a shift in the mix of homes selling, Forney's softening shows up in both the overall median and the per-square-foot figure — which fell 5.6% to $150.10 — with median home size essentially unchanged. That consistency across both metrics confirms the softening is real. The primary driver is builder competition: when multiple builders are delivering homes simultaneously in a rate-sensitive market, per-square-foot pricing tends to compress as they compete for a limited buyer pool. The counterintuitive positive is days on market, which actually improved 18 days to 71 — a sign that builders are repricing proactively to move inventory rather than letting homes sit.
How long are homes sitting on the market in Forney?
Homes that closed in Q2 2026 averaged 71 days on market — down 18 days from Q2 2025's 89. That improvement in pace is one of the most telling data points in Forney's Q2 report. In a market where prices are falling, improving days on market almost always means sellers and builders are adjusting their pricing to meet buyers rather than waiting for buyers to come to elevated price points. The improvement suggests the market is finding a functional clearing price. Days to close averaged 35 days once under contract — meaning the total list-to-close timeline for a typical Forney transaction runs approximately 106 days from original list to closing.
How competitive is the Forney real estate market right now?
Forney is one of the more buyer-favorable markets in the eastern DFW corridor right now. At 6.0 months of supply, a 94.4% close-to-list ratio, and 307 active listings — many of them builder spec homes with price reductions already applied — buyers have genuine leverage and meaningful selection. Competition among buyers for any individual home is limited. The most active price range is $200,000–$399,000, which accounts for 72% of Q2 closings, and that's also where the most builder competition exists. Buyers in that range should focus their negotiating on builder incentives — rate buydowns, closing costs, and upgrade allowances — as much as on list price, since that's often where the most value is extracted in a new construction market.
Thinking about buying or selling in Forney? Contact The Dunnican Team — we work across the eastern DFW corridor and can help you build a strategy that reflects what's actually happening in this market right now.
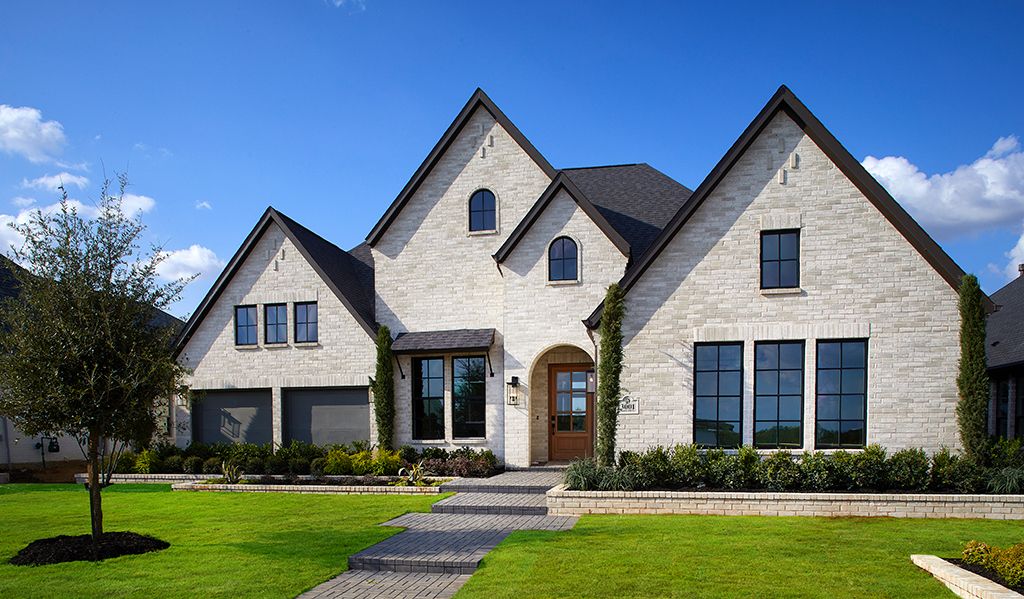
Small-Town Appeal, Big Growth, and Affordable Housing Near Dallas
Located just 20 miles east of Downtown Dallas via US-80, Forney is one of the fastest-growing cities in Kaufman County—and for good reason. Known for its small-town charm, top-rated schools, and affordable new construction, Forney offers a compelling alternative to higher-priced suburbs without sacrificing convenience or community.
As more buyers search for space, value, and quality of life, Forney continues to shine with its blend of historic character, modern amenities, and rapid residential development. Families are drawn to Forney ISD, one of the top-performing school districts in the area, while investors and first-time buyers appreciate the area's steady growth, low property taxes, and room to build equity.
Forney’s housing market is dynamic, welcoming a wide range of buyers—from those just entering the market to families upgrading into larger homes. New communities and custom homes are being added every year, making it one of the most active real estate markets east of Dallas.
Home options in Forney include:
Affordable new construction in master-planned communities like Devonshire, Windmill Farms, and Gateway Parks, often with community pools, trails, and clubhouses
Spacious resale homes with updated finishes, larger lots, and modern open-concept floorplans
Custom homes on acreage, ideal for buyers wanting more land, privacy, or room for future growth
Historic homes near Downtown Forney, offering character, walkability, and renovation potential
Investment properties and starter homes, ideal for building long-term value in a rising market
Whether you're buying your first home or upsizing to meet the needs of a growing household, Forney offers more square footage, newer features, and strong value per dollar compared to many other North Texas suburbs.
Buyers are increasingly looking east of Dallas—and Forney checks all the boxes. It combines the affordability of a rural market with the infrastructure, amenities, and school quality of a suburban hub. The city’s ongoing growth means more options for dining, shopping, and recreation are arriving every year.
Here’s why Forney is on so many buyers’ shortlists:
Top-performing schools in Forney ISD, known for academic excellence and strong extracurricular programs
Master-planned communities with resort-style amenities and family-focused design
A short commute to Dallas, Rockwall, and Mesquite via US-80 and the future expansion of major roadways
Lower home prices compared to similar properties in Rowlett, Rockwall, or Sunnyvale
A tight-knit community feel, with events like Forney Market Days, parades, and Friday night football bringing neighbors together
Forney offers that rare combination of small-town warmth and big-city convenience—and buyers are taking notice.
Navigating a high-growth market like Forney takes local knowledge, strategic timing, and hands-on experience—especially when new homes, builder incentives, and fast-moving inventory are in the mix. That’s where Cindy and Cory Dunnican come in.
As founders of The Dunnican Team at Coldwell Banker Apex, Realtors®, they bring decades of real estate expertise and a faith-driven, client-first approach to every transaction. Whether you're building new, purchasing resale, or preparing to sell in a competitive market, Cindy and Cory are ready to guide you with insight, integrity, and a proven track record of success in Forney and across Kaufman County.
Let The Dunnican Team help you make your next move with confidence in one of North Texas’s fastest-growing communities.
We know what today’s buyers are looking for and how to help your home stand out in this growing market.
We know what today’s buyers are looking for and how to help your home stand out in this growing market.

9106 Royal Burgess Dr Rowlett TX 75089
9106 Royal Burgess Dr Rowlett TX 75089